03_통계량
03_1 시각화 실습
Matplotlib
- a comprehensive library for creating static, animated, and interactive visualizations in Python
Seaborn
- a Python data visualization library based on matplotlib
- provides a high-level interface for drawing attractive and informative statistical graphics
- pandas에서 쓰기 더 편한 module임
03_2 통계량
Parameter & Statistics
- Parameter(모수): A number describing a whole population
- population is a set of all elements or items that you’re interested in. (e.g., population mean, population deviation)
- Statistic (통계량): A number describing a sample
- Ideally, the sample should preserve the essential statistical features of the population to a satisfactory extent. (e.g., sample mean, sample deviation)
- Sample Statistic vs. Population Parameter

Statistics(Measures of Central Tendency)
- In statistics, a central tendency(or measure of central tendency) is a central or typical value for a probability distribution
Measures of Central Tencendy
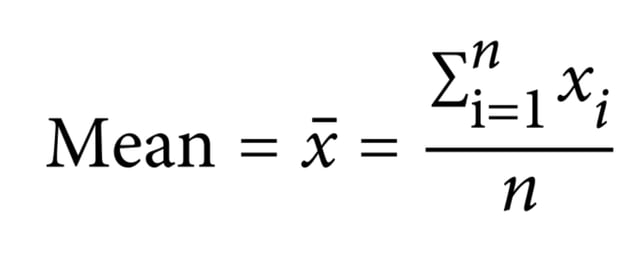
1. Mean
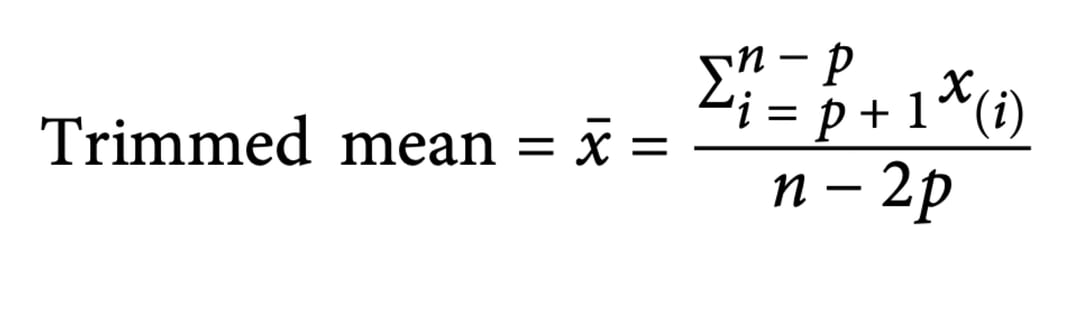
2. Trimmed Mean(절사 평균): 극단적으로 크거나 작은 값의 영향을 제거하기 위해 사용
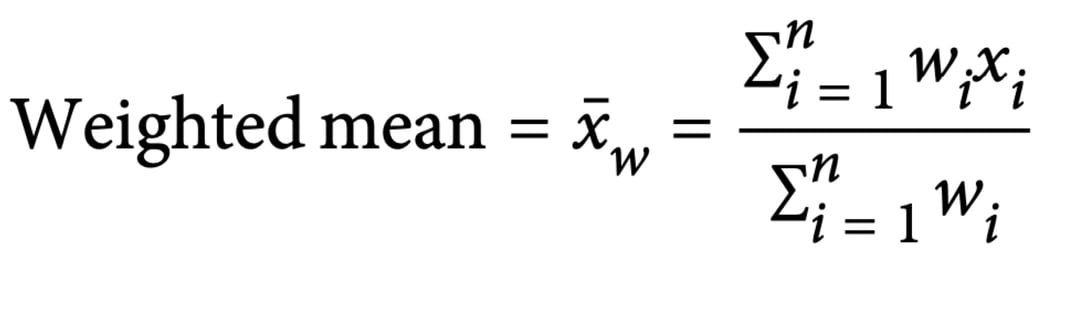
3. Weighted Mean(가중 평균): 각 변수의 중요도가 다른 경우)
4. Median
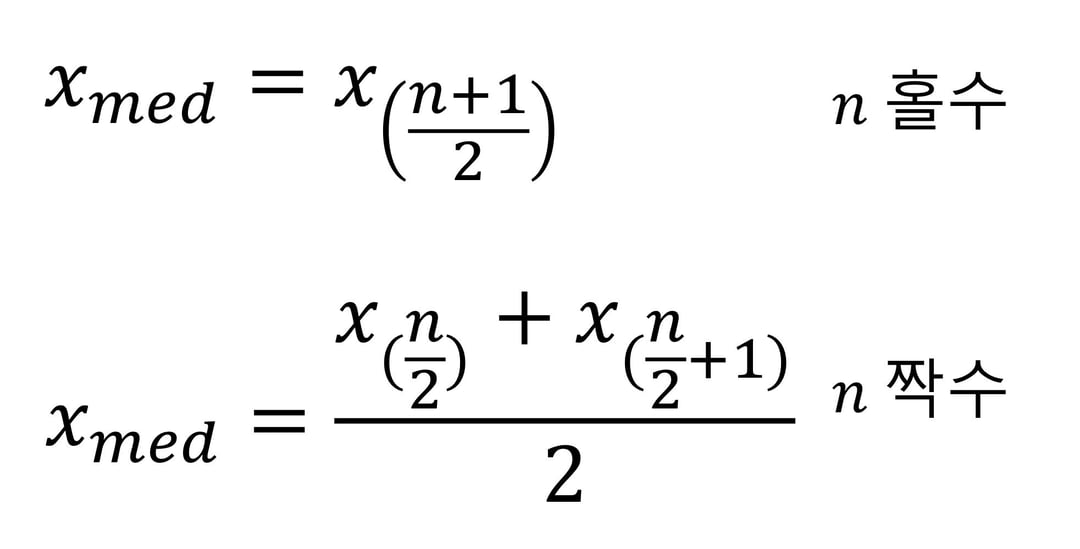
- Median and Robust Estimates: Robust statistics are statistics with good performance for data drawn from a wide range of probability distributions, especially for distributions that are not normal
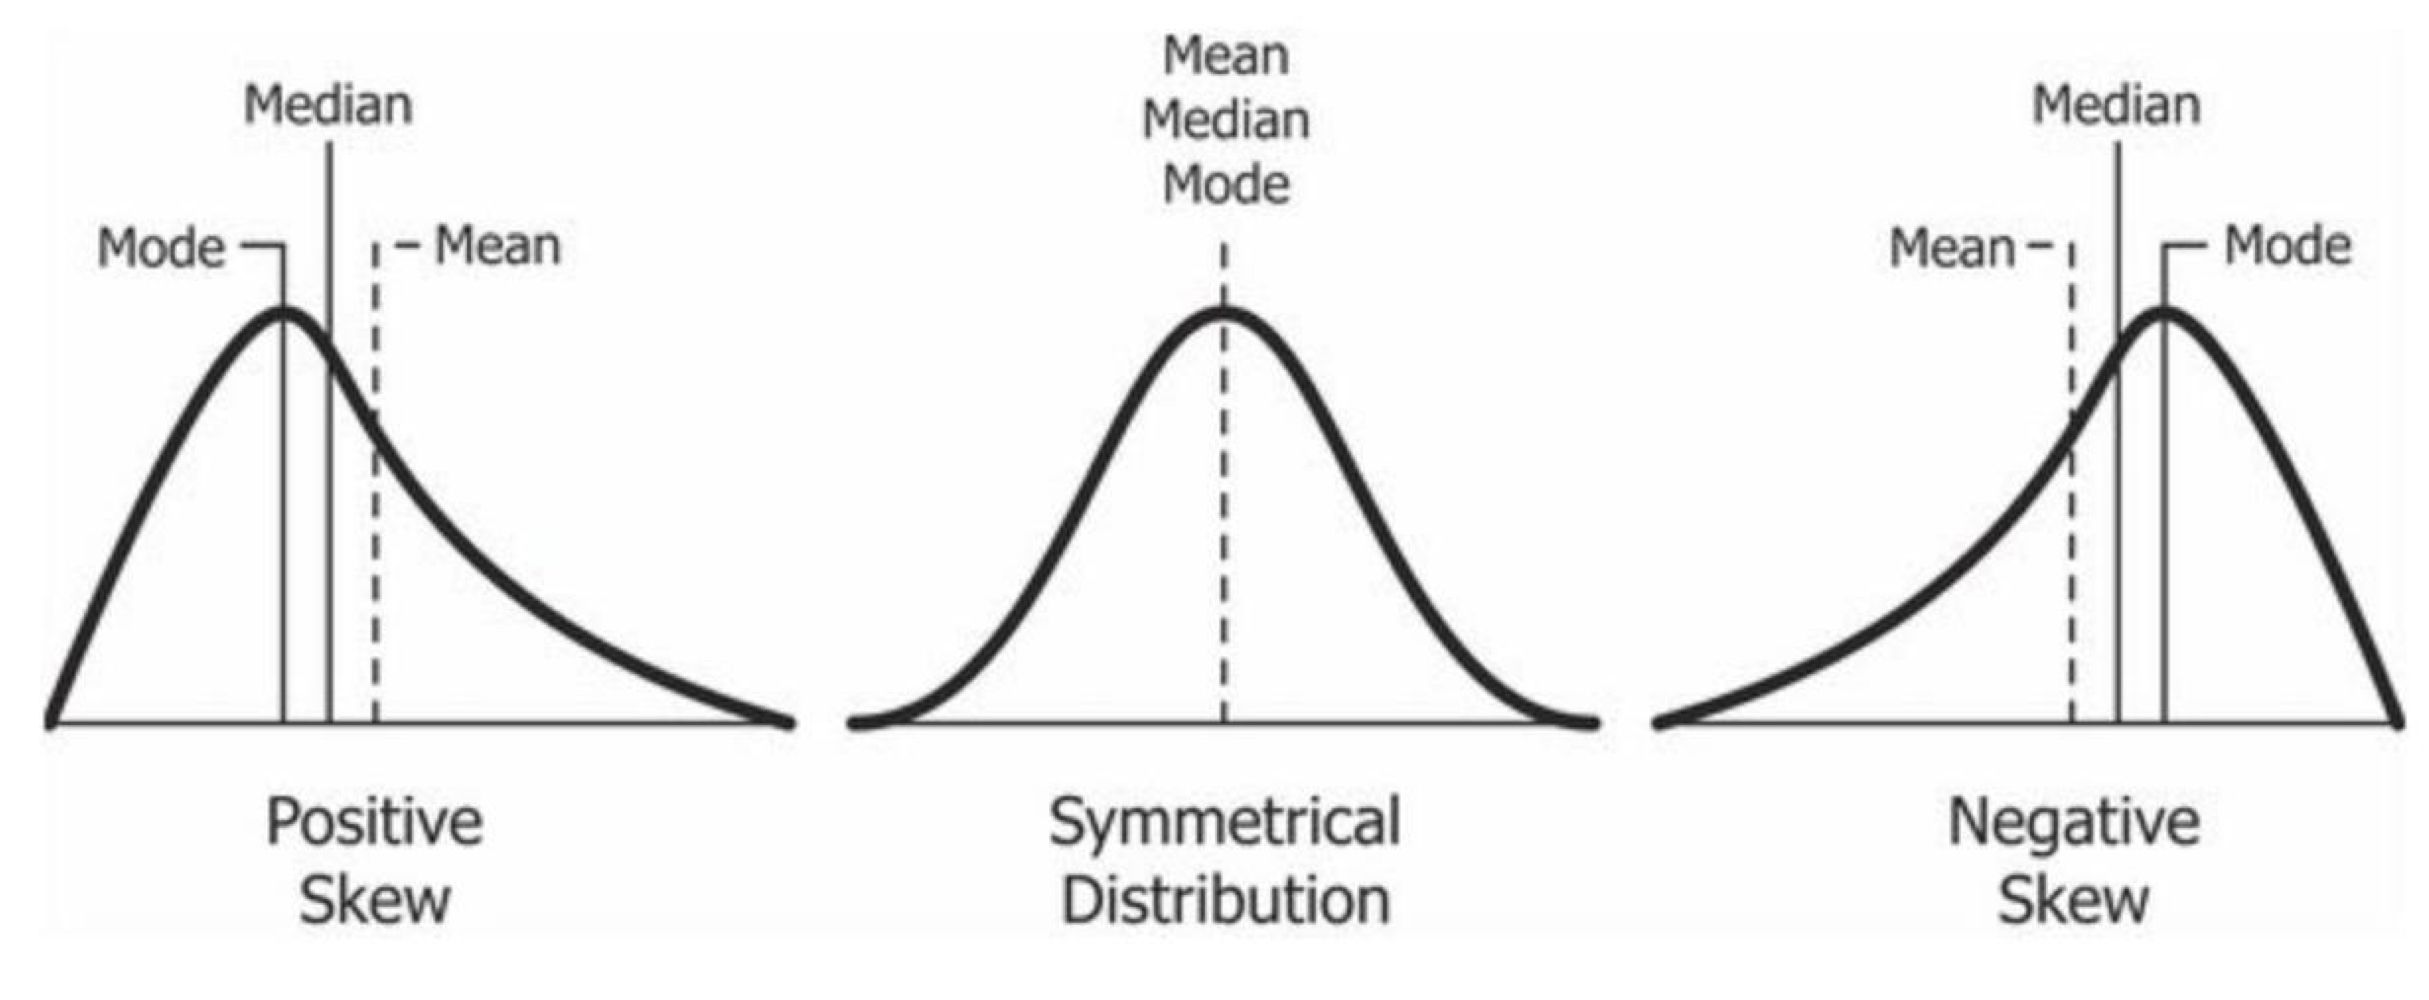
5. Skewness(왜도): 데이터 분포의 비대칭성
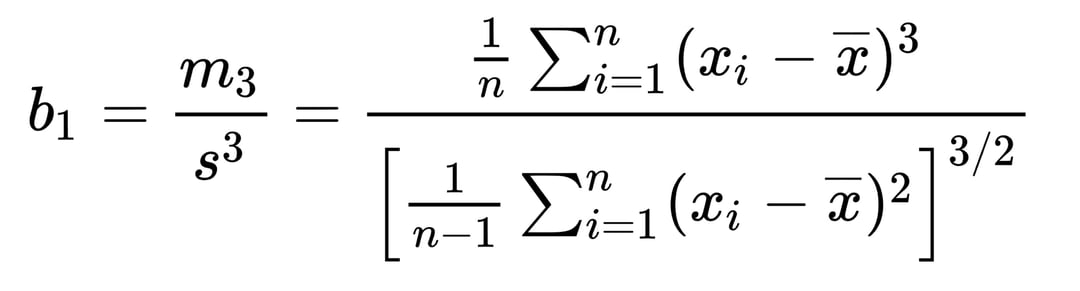
- If the skewness is between -0.5 and 0.5, the data are fairly symmetrical.
- If the skewness is between -1 and -0.5 (negatively skewed) or between 0.5 and 1(positively skewed), the data are moderately skewed.
- If the skewness is less than -1(negatively skewed) or greater than 1(positively skewed), the data are highly skewed.
Estimates of Variability
1. Variance

2. Standard deviation

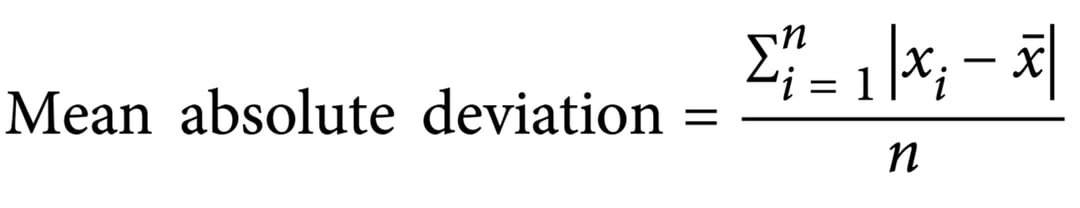
3. Mean absolute deviation(평균 절대 편차)
4. Median absolute deviation(중앙값 절대 편차) → a robust estimate of variability

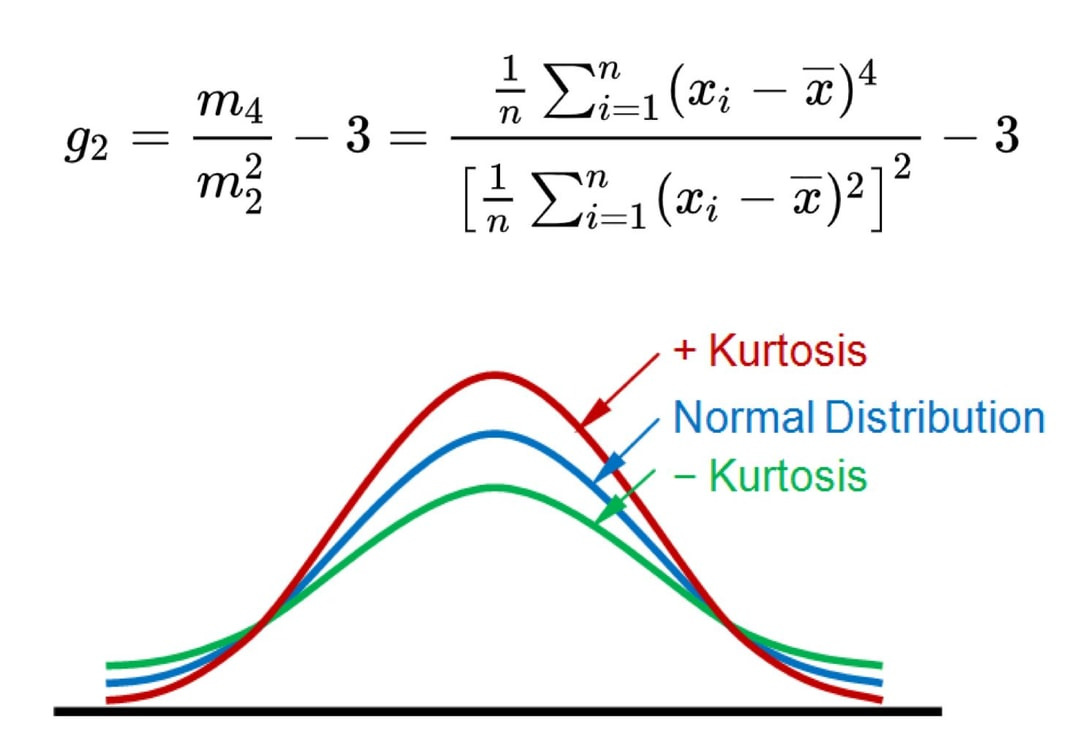
5. Kurtosis(첨도): 정규분포와 비교했을 때 data distribution의 뾰족한 정도
Estimates Based on Percentiles
- statistics is based on sorted data and the most basic measure is the range(= the difference between the largest and smallest numbers). So following problems can exist:
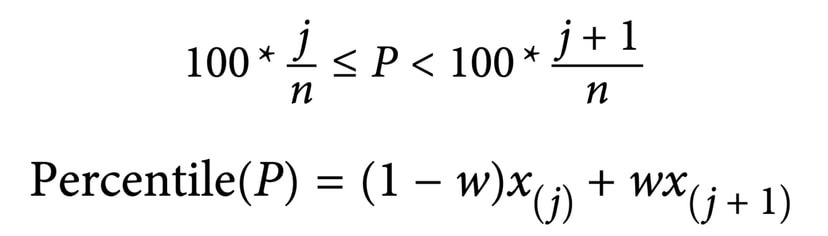
1. Percentile: In a data set, the Pth percentile is a value such that at least P percent of the values take on this value or less and at least (100 – P) percent of the values take on this value or more.
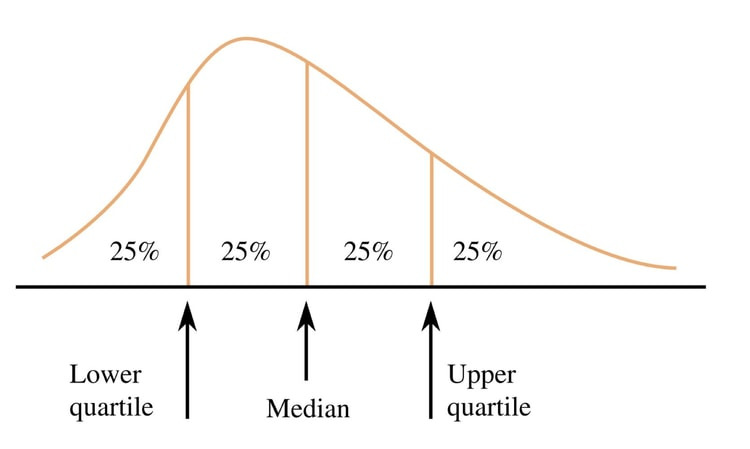
2. Quartile(사분위수): Data를 sorting 하고 25%, 50%, 75%, 100% 의 값
– Q1: lower quartile / 25th percentile
– Q2: median / 50th percentile
– Q3: upper quartile / 75th percentile
3. IQR(Interquartile range, 사분위수 범위): Q3 - Q1
- data의 분산 정도를 측정하는 measure 중 하나
- IQR이 크면 데이터가 흩어져 있을 가능성이 높음
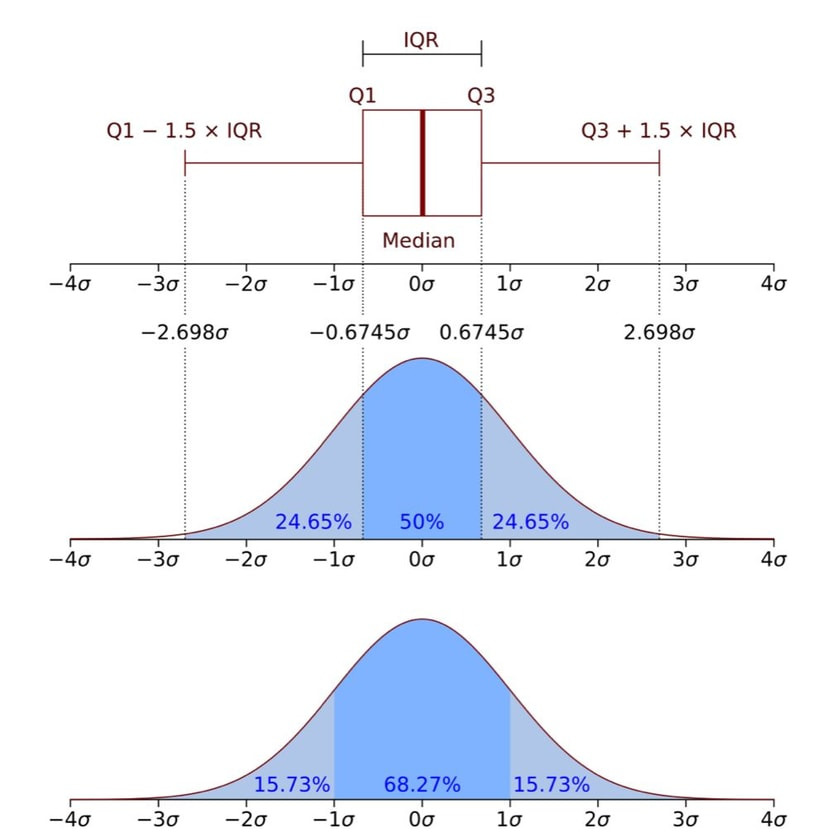
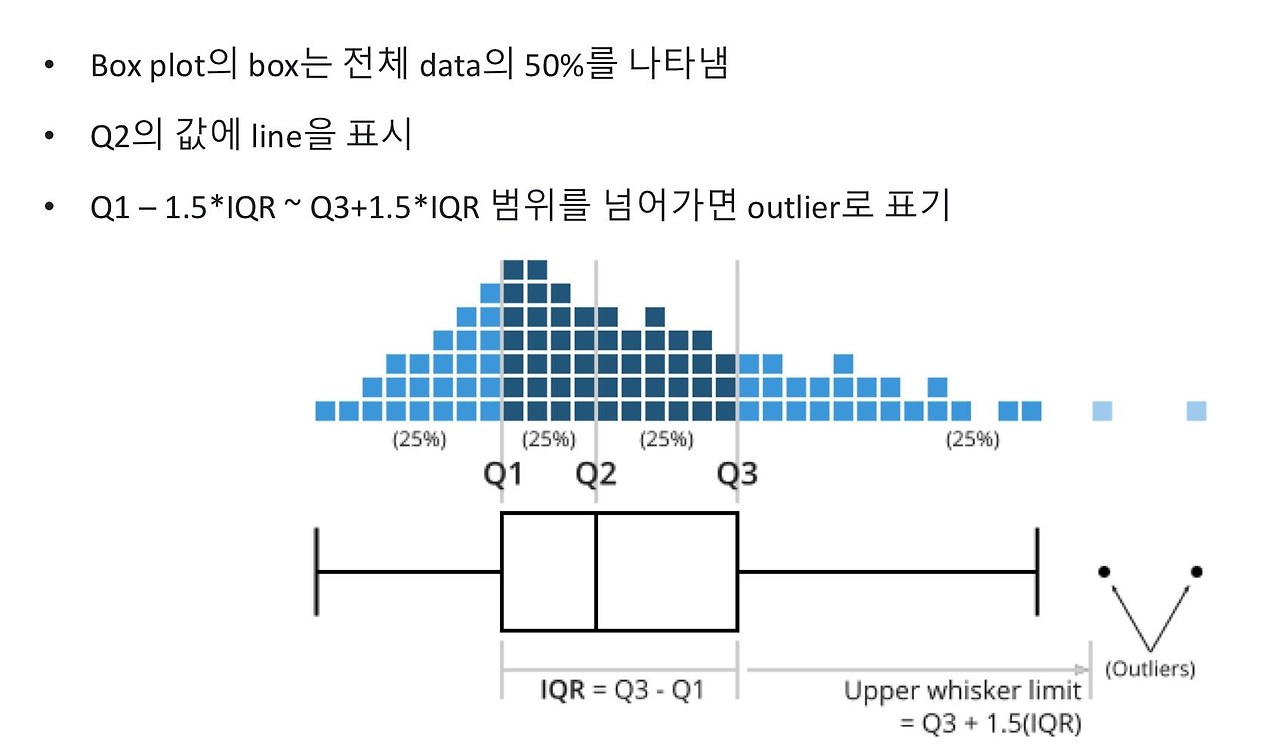
- Boxplot: uses boxes and lines to depict the distributions of one or more groups of numeric data
- data의 경향성을 보여줌
- group, category 간 비교가 필요할 때
- skew, variance, outlier 등을 알 수 있음
- data distribution의 자세한 형태는 알 수 없음
- Simpson’s Paradox: a phenomenon in probability and statistics in which a trend appears in several groups of data but disappears or reverses when the groups are combined. This result is often encountered in social-science and medical-science statistics